
 Yahoo News
 E-mini S&P 500 Index (ES) Futures Technical Analysis – Trader Reaction to 3486.25 Sets the Tone on Monday
December E-mini S&P 500 Index futures edged lower on Friday, diverging from the benchmark cash index as investors remained disappointed by the lack of progress toward a fiscal stimulus deal. There was also an air of caution over the lack of clarity regarding the timeline for the development of a coronavirus vaccine. Underpinning prices however was a much better-than-expected retail sales report.
On Friday, December E-mini S&P 500 Index futures settled at 3462.25, down 13.25 or -0.38%.
In other news, third-quarter reporting season burst from the starting gate this week, with 49 of the companies in the S&P 500 having reported. Of those, 86% have cleared the low bar set by expectations, according to Refinitiv, Reuters reported.
Daily Swing Chart Technical Analysis
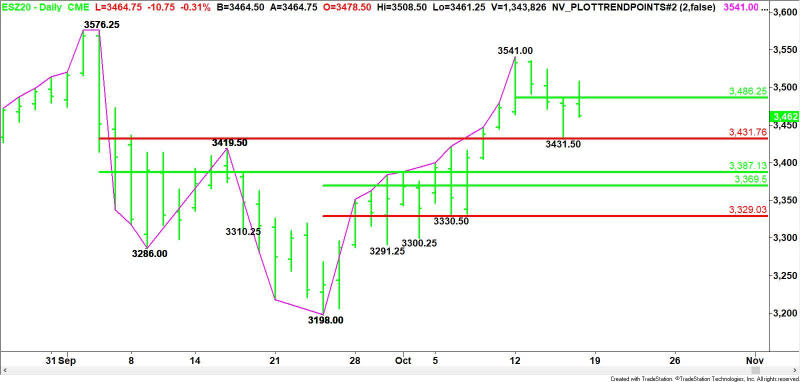
The main trend is up according to the daily swing chart. A trade through 3541.00 will signal a resumption of the uptrend. The main trend will change to down on a move through 3198.00. This is highly unlikely, but the market is in a position to change the minor trend to down.
The minor trend is also up. A trade through 3431.50 will change the minor trend to down. This will also shift momentum to the downside.
The minor range is 3541.00 to 3431.50. The close under its 50% level or pivot at 3486.25 makes this level new resistance.
On the downside, the first target is the short-term Fibonacci level at 3431.75. This is followed by the short-term 50% level at 3387.00.
Short-Term Outlook
Our focus will be on 3486.25 on Monday because of the possibility of a secondary lower top. This would suggest the presence of counter-trend sellers.
If the selling pressure continues on Monday then look for the move to extend into the support cluster at 3431.75 to 3431.50. Since the main trend is up, we could see a technical bounce on the first test of this area, but if 3431.50 fails as support then look for the selling to possibly extend into the 50% level at 3387.00. A failure at this level will suggest a bigger break is coming.
Overcoming 3486.25 will signal the presence of buyers. This could create the momentum needed to challenge the top at 3541.00.
For a look at all of today’s economic events, check out our economic calendar.
This article was originally posted on FX Empire
More From FXEMPIRE:
The Week Ahead – U.S Politics, COVID-19, Brexit, and Private Sector PMIs in Focus
US Stock Market Overview – Stock Rise Led by Strong Retail Sales
Natural Gas Price Fundamental Daily Forecast – Bulls Hoping for Weather, LNG Demand to Align
Ethereum, Litecoin, and Ripple’s XRP – Daily Tech Analysis – October 17th, 2020

