
 Yahoo News
 EBOS Group Limited's (NZSE:EBO) Stock Is Going Strong: Is the Market Following Fundamentals?

Most readers would already be aware that EBOS Group's (NZSE:EBO) stock increased significantly by 18% over the past three months. Given the company's impressive performance, we decided to study its financial indicators more closely as a company's financial health over the long-term usually dictates market outcomes. Particularly, we will be paying attention to EBOS Group's ROE today.
ROE or return on equity is a useful tool to assess how effectively a company can generate returns on the investment it received from its shareholders. In short, ROE shows the profit each dollar generates with respect to its shareholder investments.
See our latest analysis for EBOS Group
How Do You Calculate Return On Equity?
Return on equity can be calculated by using the formula:
Return on Equity = Net Profit (from continuing operations) ÷ Shareholders' Equity
So, based on the above formula, the ROE for EBOS Group is:
12% = AU$162m ÷ AU$1.3b (Based on the trailing twelve months to June 2020).
The 'return' refers to a company's earnings over the last year. Another way to think of that is that for every NZ$1 worth of equity, the company was able to earn NZ$0.12 in profit.
Why Is ROE Important For Earnings Growth?
We have already established that ROE serves as an efficient profit-generating gauge for a company's future earnings. We now need to evaluate how much profit the company reinvests or "retains" for future growth which then gives us an idea about the growth potential of the company. Assuming all else is equal, companies that have both a higher return on equity and higher profit retention are usually the ones that have a higher growth rate when compared to companies that don't have the same features.
EBOS Group's Earnings Growth And 12% ROE
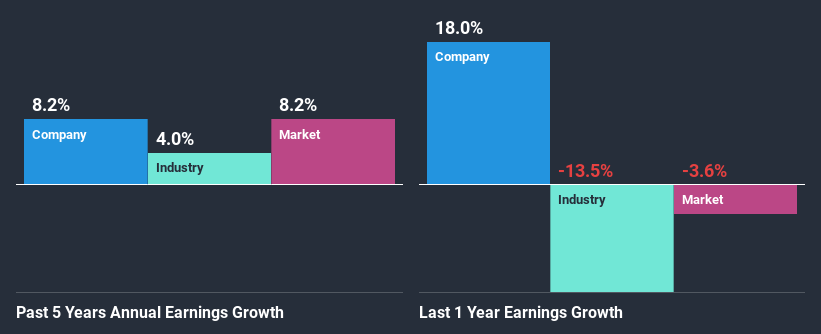
To start with, EBOS Group's ROE looks acceptable. Especially when compared to the industry average of 8.9% the company's ROE looks pretty impressive. Probably as a result of this, EBOS Group was able to see a decent growth of 8.2% over the last five years.
We then performed a comparison between EBOS Group's net income growth with the industry, which revealed that the company's growth is similar to the average industry growth of 10% in the same period.
Earnings growth is an important metric to consider when valuing a stock. What investors need to determine next is if the expected earnings growth, or the lack of it, is already built into the share price. By doing so, they will have an idea if the stock is headed into clear blue waters or if swampy waters await. What is EBO worth today? The intrinsic value infographic in our free research report helps visualize whether EBO is currently mispriced by the market.
Is EBOS Group Efficiently Re-investing Its Profits?
EBOS Group has a significant three-year median payout ratio of 73%, meaning that it is left with only 27% to reinvest into its business. This implies that the company has been able to achieve decent earnings growth despite returning most of its profits to shareholders.
Additionally, EBOS Group has paid dividends over a period of at least ten years which means that the company is pretty serious about sharing its profits with shareholders. Upon studying the latest analysts' consensus data, we found that the company is expected to keep paying out approximately 71% of its profits over the next three years. As a result, EBOS Group's ROE is not expected to change by much either, which we inferred from the analyst estimate of 14% for future ROE.
Summary
In total, we are pretty happy with EBOS Group's performance. In particular, its high ROE is quite noteworthy and also the probable explanation behind its considerable earnings growth. Yet, the company is retaining a small portion of its profits. Which means that the company has been able to grow its earnings in spite of it, so that's not too bad. We also studied the latest analyst forecasts and found that the company's earnings growth is expected be similar to its current growth rate. To know more about the company's future earnings growth forecasts take a look at this free report on analyst forecasts for the company to find out more.
This article by Simply Wall St is general in nature. It does not constitute a recommendation to buy or sell any stock, and does not take account of your objectives, or your financial situation. We aim to bring you long-term focused analysis driven by fundamental data. Note that our analysis may not factor in the latest price-sensitive company announcements or qualitative material. Simply Wall St has no position in any stocks mentioned.
Have feedback on this article? Concerned about the content? Get in touch with us directly. Alternatively, email editorial-team@simplywallst.com.

