
 Yahoo News
 Should Ework Group AB (publ) (STO:EWRK) Be Part Of Your Income Portfolio?

Dividend paying stocks like Ework Group AB (publ) (STO:EWRK) tend to be popular with investors, and for good reason - some research suggests a significant amount of all stock market returns come from reinvested dividends. Yet sometimes, investors buy a stock for its dividend and lose money because the share price falls by more than they earned in dividend payments.
In this case, Ework Group likely looks attractive to investors, given its 5.4% dividend yield and a payment history of over ten years. We'd guess that plenty of investors have purchased it for the income. Some simple analysis can offer a lot of insights when buying a company for its dividend, and we'll go through this below.
Click the interactive chart for our full dividend analysis
Payout ratios
Companies (usually) pay dividends out of their earnings. If a company is paying more than it earns, the dividend might have to be cut. As a result, we should always investigate whether a company can afford its dividend, measured as a percentage of a company's net income after tax. In the last year, Ework Group paid out 103% of its profit as dividends. Unless there are extenuating circumstances, from the perspective of an investor who hopes to own the company for many years, a payout ratio of above 100% is definitely a concern.
In addition to comparing dividends against profits, we should inspect whether the company generated enough cash to pay its dividend. With a cash payout ratio of 4828%, Ework Group's dividend payments are poorly covered by cash flow. Paying out more than 100% of your free cash flow in dividends is generally not a long-term, sustainable state of affairs, so we think shareholders should watch this metric closely. As Ework Group's dividend was not well covered by either earnings or cash flow, we would be concerned that this dividend could be at risk over the long term.
Is Ework Group's Balance Sheet Risky?
As Ework Group's dividend was not well covered by earnings, we need to check its balance sheet for signs of financial distress. A quick check of its financial situation can be done with two ratios: net debt divided by EBITDA (earnings before interest, tax, depreciation and amortisation), and net interest cover. Net debt to EBITDA measures total debt load relative to company earnings (lower = less debt), while net interest cover measures the ability to pay interest on the debt (higher = greater ability to pay interest costs). Ework Group has net debt of 2.28 times its EBITDA. Using debt can accelerate business growth, but also increases the risks.
We calculated its interest cover by measuring its earnings before interest and tax (EBIT), and dividing this by the company's net interest expense. Net interest cover of 9.51 times its interest expense appears reasonable for Ework Group, although we're conscious that even high interest cover doesn't make a company bulletproof.
Remember, you can always get a snapshot of Ework Group's latest financial position, by checking our visualisation of its financial health.
Dividend Volatility
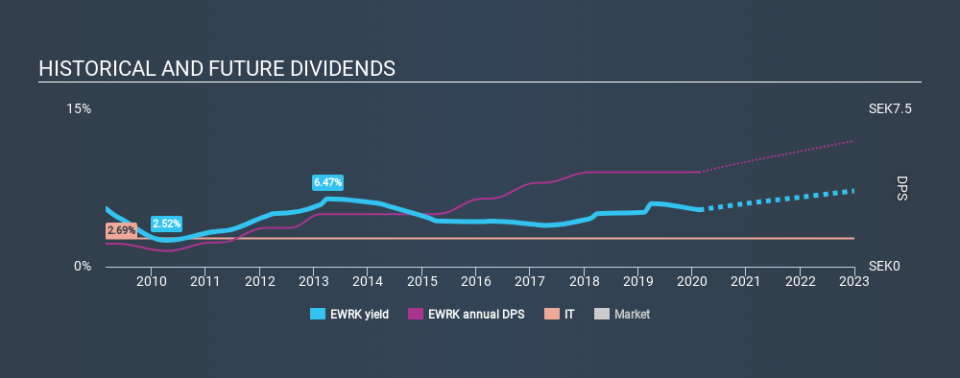
One of the major risks of relying on dividend income, is the potential for a company to struggle financially and cut its dividend. Not only is your income cut, but the value of your investment declines as well - nasty. For the purpose of this article, we only scrutinise the last decade of Ework Group's dividend payments. This dividend has been unstable, which we define as having been cut one or more times over this time. During the past ten-year period, the first annual payment was kr1.10 in 2010, compared to kr4.50 last year. Dividends per share have grown at approximately 15% per year over this time. Ework Group's dividend payments have fluctuated, so it hasn't grown 15% every year, but the CAGR is a useful rule of thumb for approximating the historical growth.
It's not great to see that the payment has been cut in the past. We're generally more wary of companies that have cut their dividend before, as they tend to perform worse in an economic downturn.
Dividend Growth Potential
With a relatively unstable dividend, it's even more important to see if earnings per share (EPS) are growing. Why take the risk of a dividend getting cut, unless there's a good chance of bigger dividends in future? It's good to see Ework Group has been growing its earnings per share at 12% a year over the past five years. Although earnings per share are up nicely Ework Group is paying out 103% of its earnings as dividends, which we feel is borderline unsustainable without extenuating circumstances.
Conclusion
Dividend investors should always want to know if a) a company's dividends are affordable, b) if there is a track record of consistent payments, and c) if the dividend is capable of growing. Ework Group paid out almost all of its cash flow and profit as dividends, leaving little to reinvest in the business. We were also glad to see it growing earnings, but it was concerning to see the dividend has been cut at least once in the past. With this information in mind, we think Ework Group may not be an ideal dividend stock.
Now, if you want to look closer, it would be worth checking out our free research on Ework Group management tenure, salary, and performance.
We have also put together a list of global stocks with a market capitalisation above $1bn and yielding more 3%.
If you spot an error that warrants correction, please contact the editor at editorial-team@simplywallst.com. This article by Simply Wall St is general in nature. It does not constitute a recommendation to buy or sell any stock, and does not take account of your objectives, or your financial situation. Simply Wall St has no position in the stocks mentioned.
We aim to bring you long-term focused research analysis driven by fundamental data. Note that our analysis may not factor in the latest price-sensitive company announcements or qualitative material. Thank you for reading.

