
 Yahoo News
 Here's What STV Group plc's (LON:STVG) Shareholder Ownership Structure Looks Like

Every investor in STV Group plc (LON:STVG) should be aware of the most powerful shareholder groups. Generally speaking, as a company grows, institutions will increase their ownership. Conversely, insiders often decrease their ownership over time. We also tend to see lower insider ownership in companies that were previously publicly owned.
STV Group is a smaller company with a market capitalization of UK£126m, so it may still be flying under the radar of many institutional investors. Taking a look at our data on the ownership groups (below), it seems that institutions own shares in the company. Let's take a closer look to see what the different types of shareholders can tell us about STV Group.
See our latest analysis for STV Group
What Does The Institutional Ownership Tell Us About STV Group?
Institutional investors commonly compare their own returns to the returns of a commonly followed index. So they generally do consider buying larger companies that are included in the relevant benchmark index.
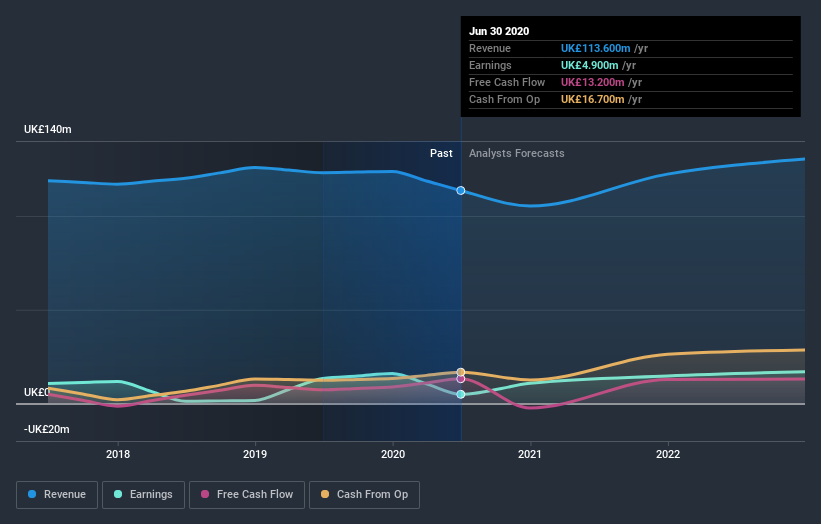
STV Group already has institutions on the share registry. Indeed, they own a respectable stake in the company. This implies the analysts working for those institutions have looked at the stock and they like it. But just like anyone else, they could be wrong. If multiple institutions change their view on a stock at the same time, you could see the share price drop fast. It's therefore worth looking at STV Group's earnings history below. Of course, the future is what really matters.
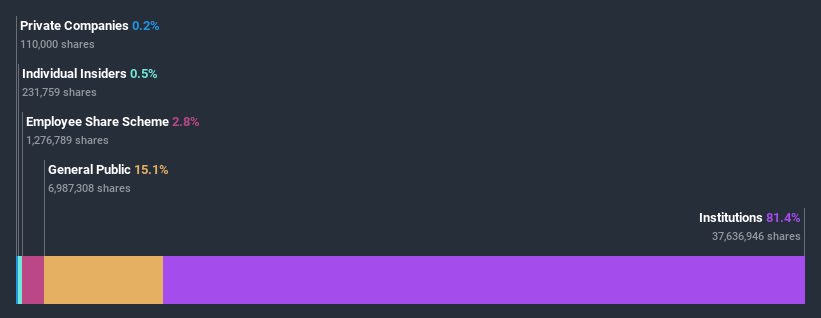
Institutional investors own over 50% of the company, so together than can probably strongly influence board decisions. STV Group is not owned by hedge funds. Slater Investments Limited is currently the company's largest shareholder with 8.3% of shares outstanding. In comparison, the second and third largest shareholders hold about 7.8% and 6.7% of the stock.
We also observed that the top 8 shareholders account for more than half of the share register, with a few smaller shareholders to balance the interests of the larger ones to a certain extent.
Researching institutional ownership is a good way to gauge and filter a stock's expected performance. The same can be achieved by studying analyst sentiments. Quite a few analysts cover the stock, so you could look into forecast growth quite easily.
Insider Ownership Of STV Group
The definition of company insiders can be subjective and does vary between jurisdictions. Our data reflects individual insiders, capturing board members at the very least. Management ultimately answers to the board. However, it is not uncommon for managers to be executive board members, especially if they are a founder or the CEO.
I generally consider insider ownership to be a good thing. However, on some occasions it makes it more difficult for other shareholders to hold the board accountable for decisions.
Our information suggests that STV Group plc insiders own under 1% of the company. It seems the board members have no more than UK£630k worth of shares in the UK£126m company. Many investors in smaller companies prefer to see the board more heavily invested. You can click here to see if those insiders have been buying or selling.
General Public Ownership
The general public, with a 15% stake in the company, will not easily be ignored. While this group can't necessarily call the shots, it can certainly have a real influence on how the company is run.
Next Steps:
While it is well worth considering the different groups that own a company, there are other factors that are even more important. Take risks for example - STV Group has 4 warning signs we think you should be aware of.
But ultimately it is the future, not the past, that will determine how well the owners of this business will do. Therefore we think it advisable to take a look at this free report showing whether analysts are predicting a brighter future.
NB: Figures in this article are calculated using data from the last twelve months, which refer to the 12-month period ending on the last date of the month the financial statement is dated. This may not be consistent with full year annual report figures.
This article by Simply Wall St is general in nature. It does not constitute a recommendation to buy or sell any stock, and does not take account of your objectives, or your financial situation. We aim to bring you long-term focused analysis driven by fundamental data. Note that our analysis may not factor in the latest price-sensitive company announcements or qualitative material. Simply Wall St has no position in any stocks mentioned.
Have feedback on this article? Concerned about the content? Get in touch with us directly. Alternatively, email editorial-team@simplywallst.com.

