
 Yahoo News
 History of recent elections as the Isle of Wight prepares to go to the polls
Isle of Wight is a former constituency.
It was the largest in the country but ceased to exist following the boundary change in 2024.
When Islanders go to the polls on July 4 they will choose two MPs, one for the new constituency of IW East and one for the new constituency of IW West.
Here we look back at who has held the Isle of Wight seat in recent history, and how they got there.
The seat was last held by Bob Seely (Conservative) between June 8, 2017, to May 30, 2024.
General Election 2019:
Conservative hold (Bob Seely) with a majority of 23,737.
There was an electorate of 113,021 and a turnout of 65.9 per cent.
General Election 2017:
Conservative hold (Bob Seely) with a majority of 21,069.
There was an electorate of 110,683 and a turnout of 67.3 per cent.
General Election 2015:
Conservative hold (Andrew Turner) with a majority of 13,703.
There was an electorate of 108,804 and a turnout of 64.6 per cent.
General Election 2010:
Conservative hold (Andrew Turner) with a majority of 10,527.
There was an electorate of 109,922 and a turnout of 63.9 per cent.
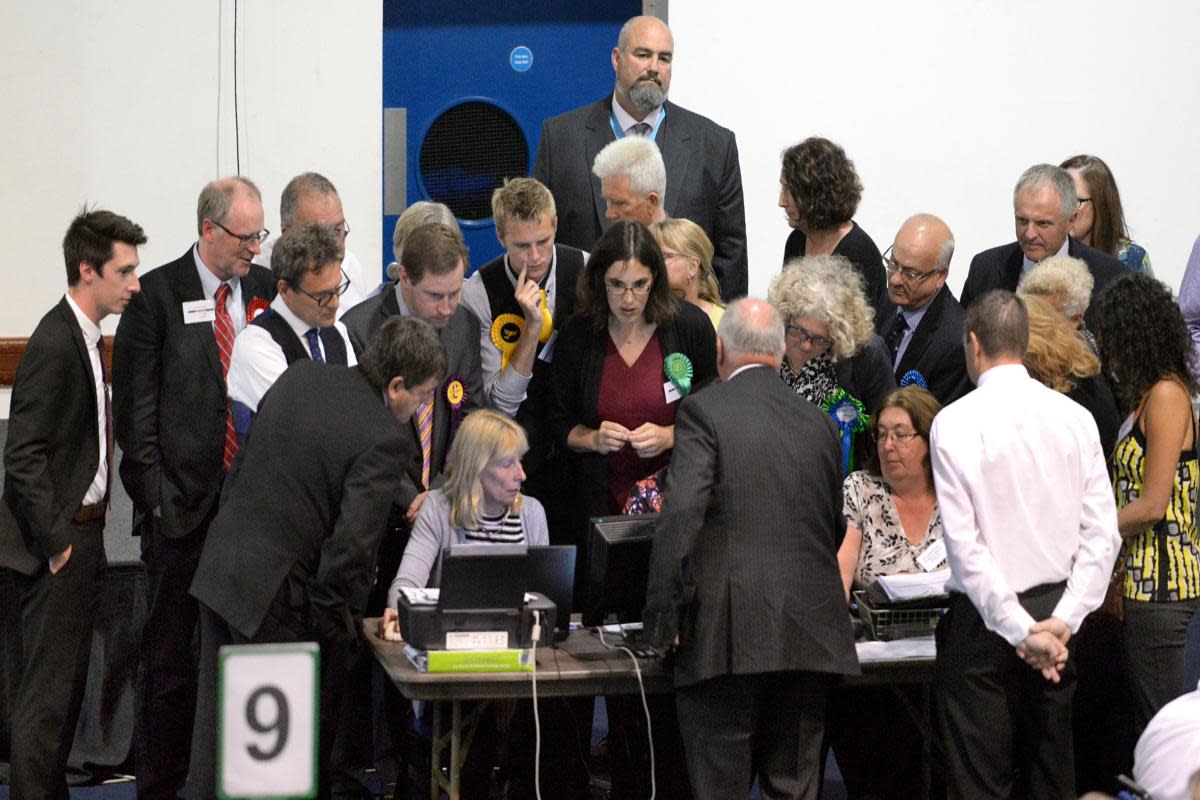
Former MP Peter Brand checking the counters at the 2010 General Election. He didn't stand that year. (Image: Isle of Wight County Press)
General Election 2005:
Conservative hold (Andrew Turner) with a majority of 12,978.
There was an electorate of 107,737 and a turnout of 61.3 per cent.
General Election 2001:
Conservative gain (Andrew Turner) with a majority of 2,826.
There was an electorate of 104,431 and a turnout of 60.8 per cent.
Secretary of State, Sajid Javid visiting the IW, pictured with Andrew Turner, then MP, in 2017 (Image: Isle of Wight County Press)
General Election 1997:
Liberal Democrats gain (Peter Brand) with a majority of 6,406.
There was an electorate of 101,680 and a turnout of 72 per cent.
Then MP Peter Brand, right, with Liberal Democrats leader Paddy Ashdown (Image: Isle of Wight County Press)
General Election 1992:
Conservative hold (Barry Field) with a majority of 1,827.
There was an electorate of 99,839 and a turnout of 79.8 per cent.
General Election 1987:
Conservative gain (Barry Field) with a majority of 6,442.
There was an electorate of 98,694 and a turnout of 79.6 per cent.
General Election 1983:
Liberal hold (Stephen Ross) with a majority of 3,503.
There was an electorate of 94,226 and a turnout of 80 per cent.
General Election 1979:
Liberal hold (Stephen Ross) with a majority of 352.
There was an electorate of 90,961 and a turnout of 81.8 per cent.
General Election October 1974:
Liberal hold (Stephen Ross) with a majority of 2,042.
There was an electorate of 85,897 and a turnout of 76.7 per cent.
General Election February 1974:
Liberal gain (Stephen Ross) with a majority of 7,766.
There was an electorate of 85,208 and a turnout of 81.4 per cent.
An old photo of Steve Oates, left, and the then MP Barry Field, right, laying track on the new extension to Smallbrook (Image: Isle of Wight County Press)

