
 Yahoo News
 An Intrinsic Calculation For Stampede Drilling Inc. (CVE:SDI) Suggests It's 42% Undervalued
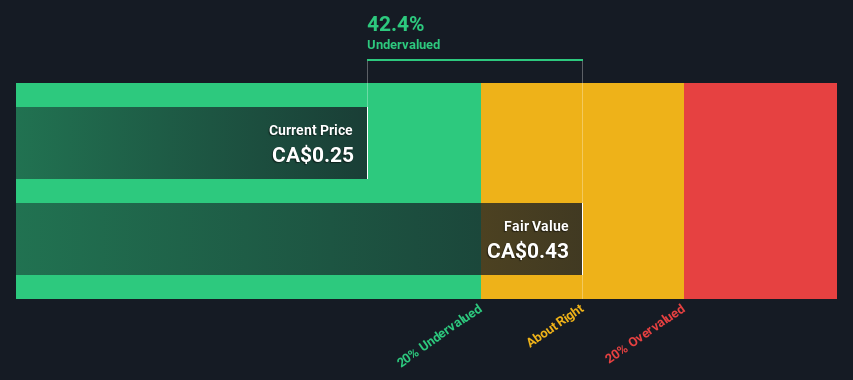
Key Insights
Stampede Drilling's estimated fair value is CA$0.43 based on 2 Stage Free Cash Flow to Equity
Stampede Drilling is estimated to be 42% undervalued based on current share price of CA$0.25
Our fair value estimate is 1.7% higher than Stampede Drilling's analyst price target of CA$0.43
Today we'll do a simple run through of a valuation method used to estimate the attractiveness of Stampede Drilling Inc. (CVE:SDI) as an investment opportunity by estimating the company's future cash flows and discounting them to their present value. We will use the Discounted Cash Flow (DCF) model on this occasion. Don't get put off by the jargon, the math behind it is actually quite straightforward.
We would caution that there are many ways of valuing a company and, like the DCF, each technique has advantages and disadvantages in certain scenarios. For those who are keen learners of equity analysis, the Simply Wall St analysis model here may be something of interest to you.
Check out our latest analysis for Stampede Drilling
What's The Estimated Valuation?
We use what is known as a 2-stage model, which simply means we have two different periods of growth rates for the company's cash flows. Generally the first stage is higher growth, and the second stage is a lower growth phase. To begin with, we have to get estimates of the next ten years of cash flows. Where possible we use analyst estimates, but when these aren't available we extrapolate the previous free cash flow (FCF) from the last estimate or reported value. We assume companies with shrinking free cash flow will slow their rate of shrinkage, and that companies with growing free cash flow will see their growth rate slow, over this period. We do this to reflect that growth tends to slow more in the early years than it does in later years.
Generally we assume that a dollar today is more valuable than a dollar in the future, and so the sum of these future cash flows is then discounted to today's value:
10-year free cash flow (FCF) estimate
2024 | 2025 | 2026 | 2027 | 2028 | 2029 | 2030 | 2031 | 2032 | 2033 | |
Levered FCF (CA$, Millions) | CA$13.0m | CA$11.0m | CA$9.88m | CA$9.23m | CA$8.86m | CA$8.66m | CA$8.57m | CA$8.55m | CA$8.59m | CA$8.67m |
Growth Rate Estimate Source | Analyst x3 | Analyst x1 | Est @ -10.18% | Est @ -6.57% | Est @ -4.04% | Est @ -2.27% | Est @ -1.03% | Est @ -0.16% | Est @ 0.44% | Est @ 0.87% |
Present Value (CA$, Millions) Discounted @ 10% | CA$11.8 | CA$9.0 | CA$7.4 | CA$6.2 | CA$5.4 | CA$4.8 | CA$4.3 | CA$3.9 | CA$3.5 | CA$3.2 |
("Est" = FCF growth rate estimated by Simply Wall St)
Present Value of 10-year Cash Flow (PVCF) = CA$60m
We now need to calculate the Terminal Value, which accounts for all the future cash flows after this ten year period. For a number of reasons a very conservative growth rate is used that cannot exceed that of a country's GDP growth. In this case we have used the 5-year average of the 10-year government bond yield (1.9%) to estimate future growth. In the same way as with the 10-year 'growth' period, we discount future cash flows to today's value, using a cost of equity of 10%.
Terminal Value (TV)= FCF2033 × (1 + g) ÷ (r – g) = CA$8.7m× (1 + 1.9%) ÷ (10%– 1.9%) = CA$104m
Present Value of Terminal Value (PVTV)= TV / (1 + r)10= CA$104m÷ ( 1 + 10%)10= CA$39m
The total value, or equity value, is then the sum of the present value of the future cash flows, which in this case is CA$98m. To get the intrinsic value per share, we divide this by the total number of shares outstanding. Compared to the current share price of CA$0.3, the company appears quite good value at a 42% discount to where the stock price trades currently. The assumptions in any calculation have a big impact on the valuation, so it is better to view this as a rough estimate, not precise down to the last cent.
Important Assumptions
The calculation above is very dependent on two assumptions. The first is the discount rate and the other is the cash flows. You don't have to agree with these inputs, I recommend redoing the calculations yourself and playing with them. The DCF also does not consider the possible cyclicality of an industry, or a company's future capital requirements, so it does not give a full picture of a company's potential performance. Given that we are looking at Stampede Drilling as potential shareholders, the cost of equity is used as the discount rate, rather than the cost of capital (or weighted average cost of capital, WACC) which accounts for debt. In this calculation we've used 10%, which is based on a levered beta of 1.696. Beta is a measure of a stock's volatility, compared to the market as a whole. We get our beta from the industry average beta of globally comparable companies, with an imposed limit between 0.8 and 2.0, which is a reasonable range for a stable business.
SWOT Analysis for Stampede Drilling
Strength
Earnings growth over the past year exceeded the industry.
Debt is not viewed as a risk.
Weakness
No major weaknesses identified for SDI.
Opportunity
Annual earnings are forecast to grow faster than the Canadian market.
Good value based on P/E ratio and estimated fair value.
Threat
Revenue is forecast to grow slower than 20% per year.
Moving On:
Although the valuation of a company is important, it shouldn't be the only metric you look at when researching a company. It's not possible to obtain a foolproof valuation with a DCF model. Instead the best use for a DCF model is to test certain assumptions and theories to see if they would lead to the company being undervalued or overvalued. For example, changes in the company's cost of equity or the risk free rate can significantly impact the valuation. What is the reason for the share price sitting below the intrinsic value? For Stampede Drilling, we've compiled three additional factors you should look at:
Risks: For instance, we've identified 2 warning signs for Stampede Drilling (1 can't be ignored) you should be aware of.
Future Earnings: How does SDI's growth rate compare to its peers and the wider market? Dig deeper into the analyst consensus number for the upcoming years by interacting with our free analyst growth expectation chart.
Other Solid Businesses: Low debt, high returns on equity and good past performance are fundamental to a strong business. Why not explore our interactive list of stocks with solid business fundamentals to see if there are other companies you may not have considered!
PS. Simply Wall St updates its DCF calculation for every Canadian stock every day, so if you want to find the intrinsic value of any other stock just search here.
Have feedback on this article? Concerned about the content? Get in touch with us directly. Alternatively, email editorial-team (at) simplywallst.com.
This article by Simply Wall St is general in nature. We provide commentary based on historical data and analyst forecasts only using an unbiased methodology and our articles are not intended to be financial advice. It does not constitute a recommendation to buy or sell any stock, and does not take account of your objectives, or your financial situation. We aim to bring you long-term focused analysis driven by fundamental data. Note that our analysis may not factor in the latest price-sensitive company announcements or qualitative material. Simply Wall St has no position in any stocks mentioned.

