
 Yahoo News
 Latest mayor election results map to keep up to date as votes are counted and 4 results already in
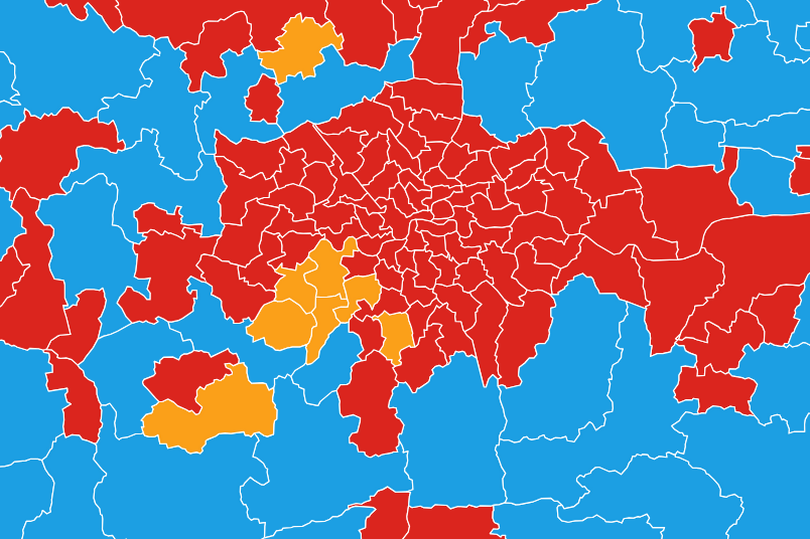
A new map for the mayoral elections 2024 shows the results as they happen across the country. Londoners are waiting in anticipation today to find out whether Sadiq Khan or Susan Hall will win the ballot.
Londoners took to their polling stations on Thursday May 2 but the race is said to be 'very close' as this year's turnout has been revealed to be lower than in 2021. Votes will be counted and results declared today (May 4).
Londoners voted for their mayor and London Assembly Members on Thursday, May 2. But London Elects has this afternoon released the turnout figure after verification of the number of ballot papers was carried out today. You can use our handy mao below to keep up to date with the latest results as they come in.
So far, four mayoral election results have already been announced. East Midlands, North East and York and North Yorkshire have been held by Labour. While Tees Valley have voted in a Conservative mayor.
MyLondon understands that Labour believes that tomorrow's result is going to be 'very close'. Mr Khan's team is also concerned about the less than 5 percentage point gap between Mr Khan and the then-Tory candidate, Shaun Bailey, in 2021.
In addition, the party's thinking is that voter ID regulations - which mean voters had to bring an acceptable form of documentation with them to polling stations or be turned away - makes it 'easier for Tories to win'. It is also understood that the mayor's team believes encouraging polling - which put Mr Khan between 10 and more than 20 percentage points ahead of his Conservative rival - were 'way out'.
Full turnout figures in London
Constituencies | Electorate | Verification totals | Turnout (%) |
|---|---|---|---|
Barnet and Camden | 413,809 | 163,830 | 39.59% |
Bexley and Bromley | 421,800 | 204,058 | 48.38% |
Brent and Harrow | 428,775 | 159,033 | 37.09% |
City and East (Barking and Dagenham, City of London, Newham, Tower Hamlets) | 628,856 | 195,989 | 31.17% |
Croydon and Sutton | 440,715 | 186,271 | 42.27% |
Ealing and Hillingdon | 453,892 | 195,095 | 42.98% |
Enfield and Haringey | 399,677 | 165,372 | 41.38% |
Greenwich and Lewisham | 399,703 | 161,183 | 40.33% |
Havering and Redbridge | 402,497 | 172,852 | 42.94% |
Lambeth and Southwark | 448,552 | 175,532 | 39.13% |
Merton and Wandsworth | 384,678 | 176,930 | 45.99% |
North East (Hackney, Islington, Waltham Forest) | 524,885 | 207,722 | 39.57% |
South West (Hounslow, Kingston Upon Thames, Richmond Upon Thames) | 455,381 | 206,109 | 45.26% |
West Central (Hammersmith and Fulham, Kensington and Chelsea, Westminster) | 359,208 | 125,645 | 34.98% |
The Greater London Returning Officer (GLRO) will announce the result of the mayoral election at City Hall tomorrow (Saturday, May 4) once all votes have been counted at the 14 constituencies. Later, the GLRO will announce the allocation of the 11 London-wide Assembly Member seats.
Once the Constituency results have been announced at each venue, the London-wide ballot papers counted, and the calculation made to allocate the 11 seats proportionally to parties or candidates.
Read our exclusive sit-down interview with Sadiq Khan ahead of the London mayoral election here. Read our full chat with Susan Hall here.
Don't miss out on the biggest stories from across the city, including the latest about the capital's transport network. Sign up to MyLondon's The 12 HERE for the 12 biggest stories each day.

