
 Yahoo News
 How Many Textron Inc. (NYSE:TXT) Shares Do Institutions Own?

If you want to know who really controls Textron Inc. (NYSE:TXT), then you'll have to look at the makeup of its share registry. Generally speaking, as a company grows, institutions will increase their ownership. Conversely, insiders often decrease their ownership over time. We also tend to see lower insider ownership in companies that were previously publicly owned.
Textron has a market capitalization of US$8.4b, so it's too big to fly under the radar. We'd expect to see both institutions and retail investors owning a portion of the company. Taking a look at our data on the ownership groups (below), it seems that institutional investors have bought into the company. Let's delve deeper into each type of owner, to discover more about Textron.
See our latest analysis for Textron

What Does The Institutional Ownership Tell Us About Textron?
Institutions typically measure themselves against a benchmark when reporting to their own investors, so they often become more enthusiastic about a stock once it's included in a major index. We would expect most companies to have some institutions on the register, especially if they are growing.
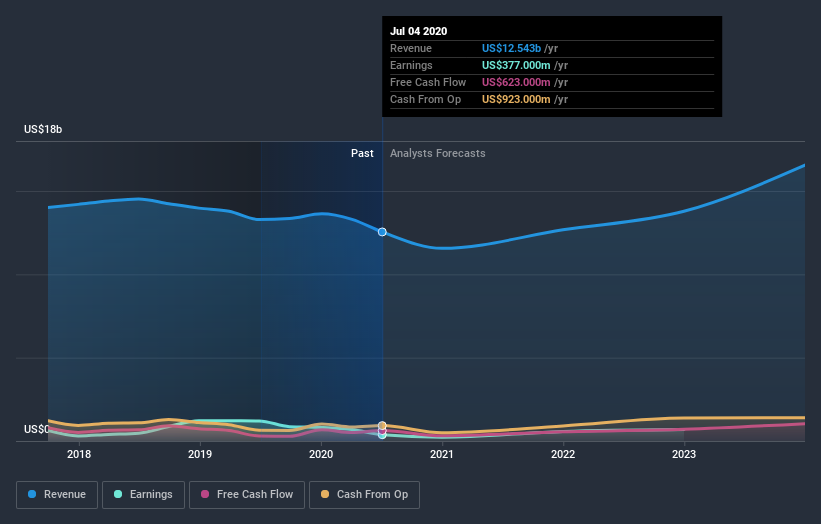
As you can see, institutional investors have a fair amount of stake in Textron. This implies the analysts working for those institutions have looked at the stock and they like it. But just like anyone else, they could be wrong. If multiple institutions change their view on a stock at the same time, you could see the share price drop fast. It's therefore worth looking at Textron's earnings history below. Of course, the future is what really matters.
Investors should note that institutions actually own more than half the company, so they can collectively wield significant power. We note that hedge funds don't have a meaningful investment in Textron. Our data shows that T. Rowe Price Group, Inc. is the largest shareholder with 15% of shares outstanding. With 11% and 7.9% of the shares outstanding respectively, The Vanguard Group, Inc. and BlackRock, Inc. are the second and third largest shareholders.
We also observed that the top 7 shareholders account for more than half of the share register, with a few smaller shareholders to balance the interests of the larger ones to a certain extent.
While it makes sense to study institutional ownership data for a company, it also makes sense to study analyst sentiments to know which way the wind is blowing. Quite a few analysts cover the stock, so you could look into forecast growth quite easily.
Insider Ownership Of Textron
The definition of an insider can differ slightly between different countries, but members of the board of directors always count. Company management run the business, but the CEO will answer to the board, even if he or she is a member of it.
Most consider insider ownership a positive because it can indicate the board is well aligned with other shareholders. However, on some occasions too much power is concentrated within this group.
Our information suggests that Textron Inc. insiders own under 1% of the company. Being so large, we would not expect insiders to own a large proportion of the stock. Collectively, they own US$39m of stock. In this sort of situation, it can be more interesting to see if those insiders have been buying or selling.
General Public Ownership
The general public holds a 14% stake in Textron. This size of ownership, while considerable, may not be enough to change company policy if the decision is not in sync with other large shareholders.
Next Steps:
I find it very interesting to look at who exactly owns a company. But to truly gain insight, we need to consider other information, too. Case in point: We've spotted 3 warning signs for Textron you should be aware of, and 1 of them is significant.
If you would prefer discover what analysts are predicting in terms of future growth, do not miss this free report on analyst forecasts.
NB: Figures in this article are calculated using data from the last twelve months, which refer to the 12-month period ending on the last date of the month the financial statement is dated. This may not be consistent with full year annual report figures.
This article by Simply Wall St is general in nature. It does not constitute a recommendation to buy or sell any stock, and does not take account of your objectives, or your financial situation. We aim to bring you long-term focused analysis driven by fundamental data. Note that our analysis may not factor in the latest price-sensitive company announcements or qualitative material. Simply Wall St has no position in any stocks mentioned.
Have feedback on this article? Concerned about the content? Get in touch with us directly. Alternatively, email editorial-team@simplywallst.com.

