
 Yahoo News
 Map shows predicted COVID infection rates across UK just before Christmas
A map that predicts where in the UK will be COVID-19 hotspots has estimated most of the country will see a decline in cases in the days before Christmas.
With COVID-19 cases falling in all four nations of the UK a team at Imperial College London has predicted the trends will continue as lockdown ends in England.
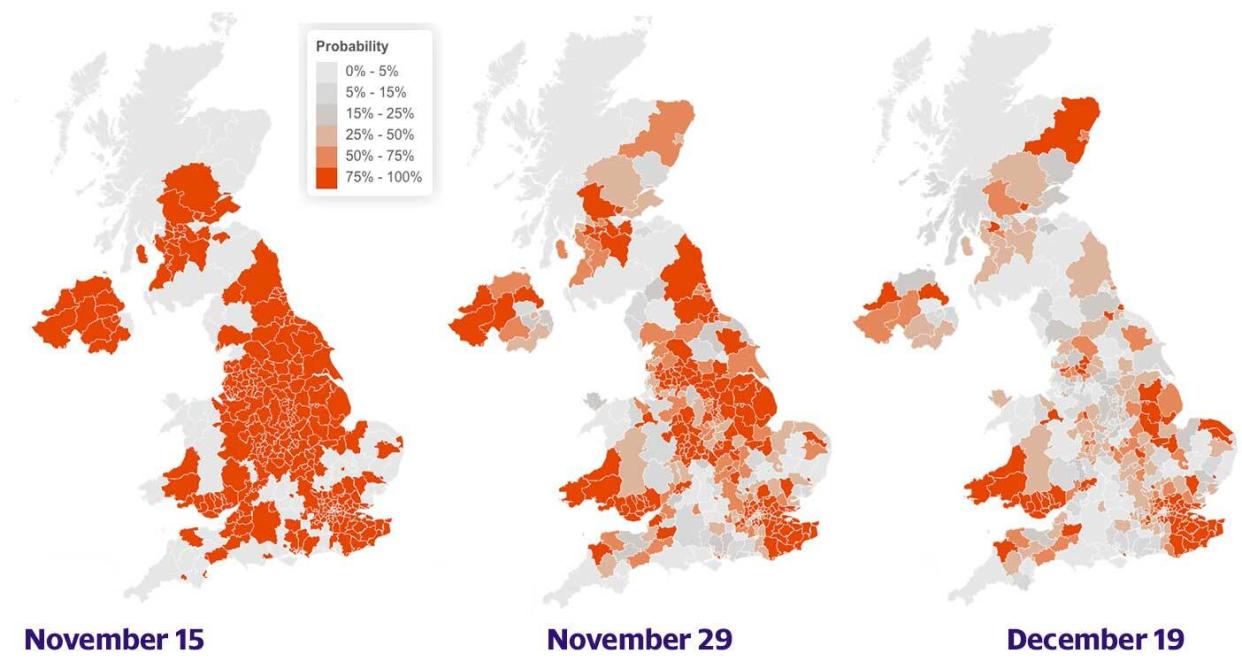
The map estimates the probability an area will be a hotspot at a certain date, a hotspot is defined as a local authority having over 100 cases per 100,000.
Watch: The COVID dos and don’ts of Christmas this year
There is still a lot of progress to go, because of the surge in cases the UK saw towards the end of September the team who run the map have changed their default hotspot definition from 50 cases per 100,000 to 100 per 100,000.
The Imperial College London team uses testing and mortality data from each local authority to estimate each area’s cases and R number in the coming weeks.
The deeper the shade of orange on the map shows the probability the area will be a hotspot, with the deepest orange being a 75-100% probability.
The site does not factor in potential changes to lockdown measures which will have an impact on case numbers.
Case numbers are expected to rise again after the Christmas relaxation of bet 23-27 December, which will allow households from across the UK to mingle again.
Christmas bubbles will allow three households to mix indoors, despite such gatherings being banned for most of the country under the normal rules.
It will take some weeks before any potential Christmas spike is seen in the data, but that will also be around the time the UK starts to see the effects of the vaccine.
Read more: 'This is of grave concern': WHO issues new warning over spread of virus across Europe
Professor Jonathan Van-Tam, deputy chief medical officer for England said on Thursday the jab from Pfizer and BioNTech – approved by the UK medicines regulator on Wednesday – will hit UK shores in “hours, not days”.
The first jabs are expected to be given to elderly within days, although they will need to a second injection three weeks later to become immune to the virus.
The vaccine needs to be stored at -70C which presents a significant logistical challenge to an operation that the government has admitted will already be a massive and hugely difficult undertaking.
Watch: COVID-19: MPs approve new coronavirus tiers - but PM suffers major Tory rebellion
England returned to a tiered system of coronavirus measures on Wednesday but Boris Johnson has said the tiers will be reviewed every two weeks so infection rates could be dramatically affected by the raising or lowering of tiers.
Wales also introduced new measures recently, banning the sale of alcohol in pubs and restaurants with all hospitality forced to close by 6pm.
Scotland and Northern Ireland have also changed their measures in recent weeks.
Read more: How the front pages reacted to UK getting a COVID vaccine approved
You can view the map referenced in this article here
The map has also shows the data from the previous two weeks.
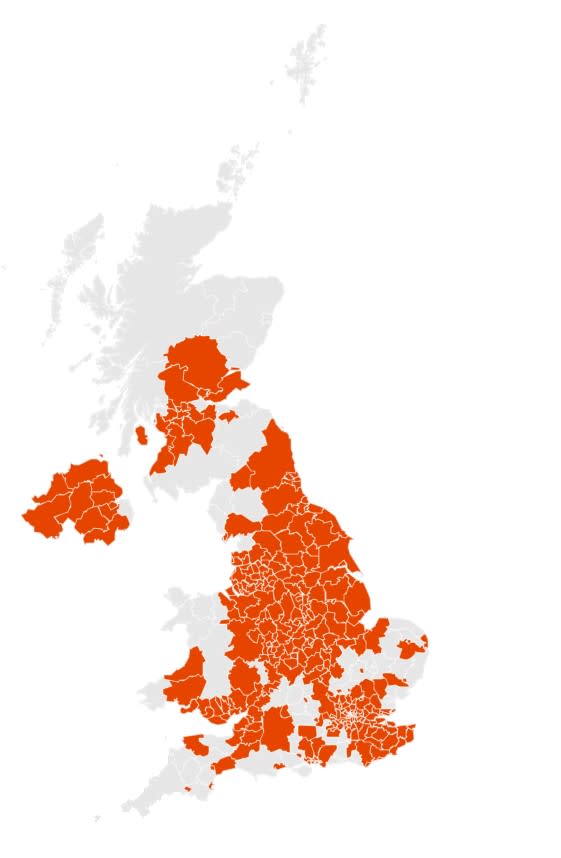
On 15 November almost all of the UK and every major population centre was a COVID-19 hotspot.
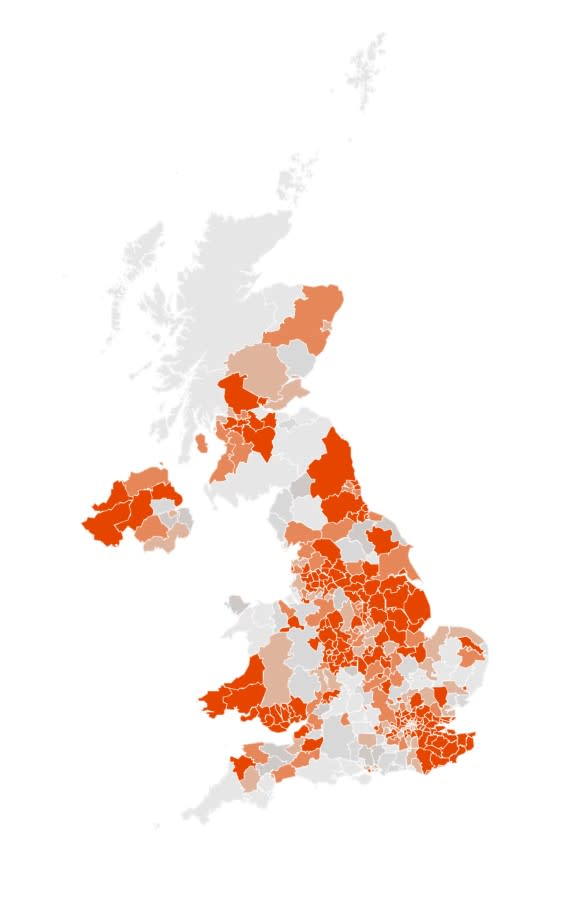
By the end of November, COVID had declined across much of the UK, but most of the UK’s major population centres were still hotspots.
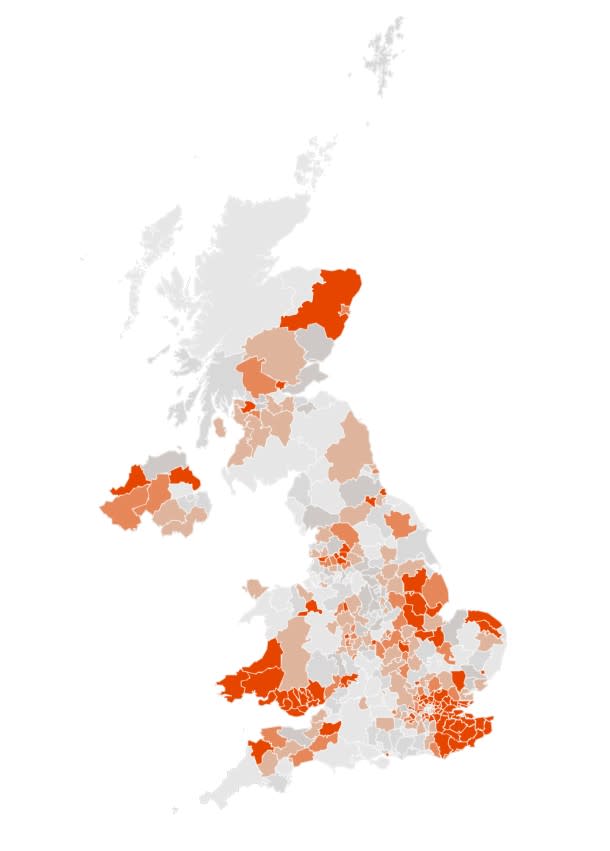
By 19 December, the map predicts COVID infection rates will have dramatically lowered in most areas of the UK, including the north of England which saw some of the highest numbers in the second wave.
Scotland and Northern Ireland are also predicted to have significantly lower COVID-19 rates in their heavily populated areas.
Some areas of the UK are still expected to suffer from high rates of COVID by 19 December.
Kent, which was put under Tier 3 last week despite most of the large county’s cases being concentrated in the more heavily populated north is expected to see some of the highest numbers in the country.
London will also still have many boroughs still classified as a hotspot by 19 December.
All of South Wales is also expected to still be a COVID-19 hotspot, despite the new measures already announced.
The north of England will see their cases number decline except for a few areas in Lancashire, Hartlepool and Darlington.
Parts of Lincolnshire and Norfolk are also expected to be COVID-19 Hotspots.
The Imperial College London map also provides estimates for areas that will have 50,200,300 and 500 cases per 100,000.
When defining a hotspot as 50 cases per 100,00 large parts of the country are expected to still be a hotspot, a number that was considered high in the summer.
The only areas of the country expected to see numbers as a high as 500 per 100,000 by 19 December are in South Wales, Kent and Boston, Lincolnshire.
Watch: How will the new 3-tier Covid system work?

