
 Yahoo News
 Here’s What Saturn Oil & Gas Inc.’s (CVE:SOIL) Return On Capital Can Tell Us

Today we are going to look at Saturn Oil & Gas Inc. (CVE:SOIL) to see whether it might be an attractive investment prospect. To be precise, we'll consider its Return On Capital Employed (ROCE), as that will inform our view of the quality of the business.
Firstly, we'll go over how we calculate ROCE. Second, we'll look at its ROCE compared to similar companies. Last but not least, we'll look at what impact its current liabilities have on its ROCE.
What is Return On Capital Employed (ROCE)?
ROCE is a measure of a company's yearly pre-tax profit (its return), relative to the capital employed in the business. All else being equal, a better business will have a higher ROCE. Ultimately, it is a useful but imperfect metric. Author Edwin Whiting says to be careful when comparing the ROCE of different businesses, since 'No two businesses are exactly alike.
How Do You Calculate Return On Capital Employed?
The formula for calculating the return on capital employed is:
Return on Capital Employed = Earnings Before Interest and Tax (EBIT) ÷ (Total Assets - Current Liabilities)
Or for Saturn Oil & Gas:
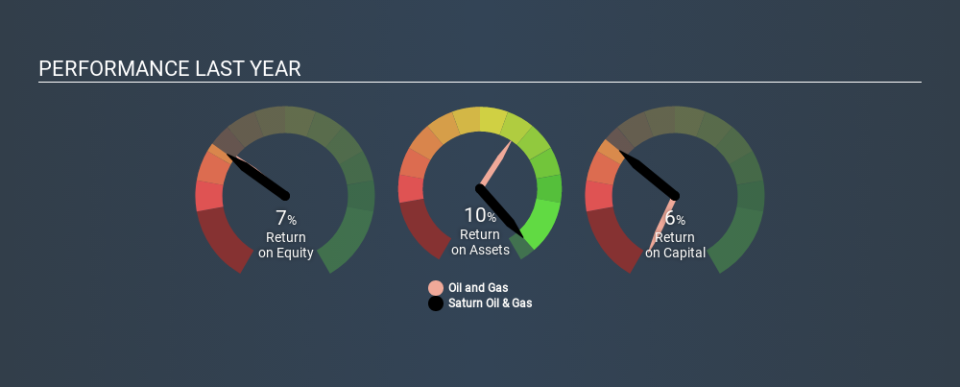
0.059 = CA$2.1m ÷ (CA$44m - CA$7.3m) (Based on the trailing twelve months to September 2019.)
Therefore, Saturn Oil & Gas has an ROCE of 5.9%.
See our latest analysis for Saturn Oil & Gas
Is Saturn Oil & Gas's ROCE Good?
ROCE can be useful when making comparisons, such as between similar companies. Using our data, Saturn Oil & Gas's ROCE appears to be around the 5.3% average of the Oil and Gas industry. Aside from the industry comparison, Saturn Oil & Gas's ROCE is mediocre in absolute terms, considering the risk of investing in stocks versus the safety of a bank account. Readers may find more attractive investment prospects elsewhere.
Saturn Oil & Gas has an ROCE of 5.9%, but it didn't have an ROCE 3 years ago, since it was unprofitable. That implies the business has been improving. You can click on the image below to see (in greater detail) how Saturn Oil & Gas's past growth compares to other companies.
It is important to remember that ROCE shows past performance, and is not necessarily predictive. Companies in cyclical industries can be difficult to understand using ROCE, as returns typically look high during boom times, and low during busts. ROCE is only a point-in-time measure. Given the industry it operates in, Saturn Oil & Gas could be considered cyclical. Since the future is so important for investors, you should check out our free report on analyst forecasts for Saturn Oil & Gas.
Do Saturn Oil & Gas's Current Liabilities Skew Its ROCE?
Current liabilities include invoices, such as supplier payments, short-term debt, or a tax bill, that need to be paid within 12 months. Due to the way ROCE is calculated, a high level of current liabilities makes a company look as though it has less capital employed, and thus can (sometimes unfairly) boost the ROCE. To counter this, investors can check if a company has high current liabilities relative to total assets.
Saturn Oil & Gas has total assets of CA$44m and current liabilities of CA$7.3m. As a result, its current liabilities are equal to approximately 17% of its total assets. This very reasonable level of current liabilities would not boost the ROCE by much.
Our Take On Saturn Oil & Gas's ROCE
That said, Saturn Oil & Gas's ROCE is mediocre, there may be more attractive investments around. You might be able to find a better investment than Saturn Oil & Gas. If you want a selection of possible winners, check out this free list of interesting companies that trade on a P/E below 20 (but have proven they can grow earnings).
If you like to buy stocks alongside management, then you might just love this free list of companies. (Hint: insiders have been buying them).
If you spot an error that warrants correction, please contact the editor at editorial-team@simplywallst.com. This article by Simply Wall St is general in nature. It does not constitute a recommendation to buy or sell any stock, and does not take account of your objectives, or your financial situation. Simply Wall St has no position in the stocks mentioned.
We aim to bring you long-term focused research analysis driven by fundamental data. Note that our analysis may not factor in the latest price-sensitive company announcements or qualitative material. Thank you for reading.

