
 Yahoo News
 Are Strong Financial Prospects The Force That Is Driving The Momentum In Austal Limited's ASX:ASB) Stock?

Most readers would already be aware that Austal's (ASX:ASB) stock increased significantly by 17% over the past three months. Since the market usually pay for a company’s long-term fundamentals, we decided to study the company’s key performance indicators to see if they could be influencing the market. Specifically, we decided to study Austal's ROE in this article.
Return on Equity or ROE is a test of how effectively a company is growing its value and managing investors’ money. In short, ROE shows the profit each dollar generates with respect to its shareholder investments.
Check out our latest analysis for Austal
How Do You Calculate Return On Equity?
The formula for ROE is:
Return on Equity = Net Profit (from continuing operations) ÷ Shareholders' Equity
So, based on the above formula, the ROE for Austal is:
12% = AU$78m ÷ AU$668m (Based on the trailing twelve months to December 2019).
The 'return' is the amount earned after tax over the last twelve months. That means that for every A$1 worth of shareholders' equity, the company generated A$0.12 in profit.
What Has ROE Got To Do With Earnings Growth?
Thus far, we have learnt that ROE measures how efficiently a company is generating its profits. Based on how much of its profits the company chooses to reinvest or "retain", we are then able to evaluate a company's future ability to generate profits. Assuming all else is equal, companies that have both a higher return on equity and higher profit retention are usually the ones that have a higher growth rate when compared to companies that don't have the same features.
A Side By Side comparison of Austal's Earnings Growth And 12% ROE
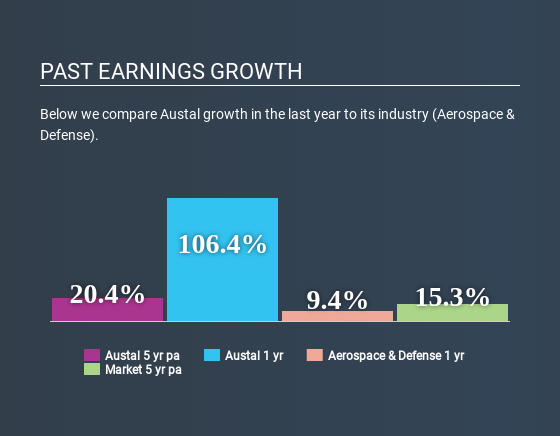
To begin with, Austal seems to have a respectable ROE. On comparing with the average industry ROE of 9.3% the company's ROE looks pretty remarkable. This certainly adds some context to Austal's exceptional 20% net income growth seen over the past five years. However, there could also be other causes behind this growth. For instance, the company has a low payout ratio or is being managed efficiently.
Next, on comparing with the industry net income growth, we found that Austal's reported growth was lower than the industry growth of 30% in the same period, which is not something we like to see.
The basis for attaching value to a company is, to a great extent, tied to its earnings growth. The investor should try to establish if the expected growth or decline in earnings, whichever the case may be, is priced in. This then helps them determine if the stock is placed for a bright or bleak future. If you're wondering about Austal's's valuation, check out this gauge of its price-to-earnings ratio, as compared to its industry.
Is Austal Making Efficient Use Of Its Profits?
The three-year median payout ratio for Austal is 46%, which is moderately low. The company is retaining the remaining 54%. By the looks of it, the dividend is well covered and Austal is reinvesting its profits efficiently as evidenced by its exceptional growth which we discussed above.
Moreover, Austal is determined to keep sharing its profits with shareholders which we infer from its long history of paying a dividend for at least ten years. Our latest analyst data shows that the future payout ratio of the company is expected to drop to 33% over the next three years. Regardless, the ROE is not expected to change much for the company despite the lower expected payout ratio.
Conclusion
Overall, we are quite pleased with Austal's performance. Specifically, we like that the company is reinvesting a huge chunk of its profits at a high rate of return. This of course has caused the company to see a good amount of growth in its earnings. With that said, the latest industry analyst forecasts reveal that the company's earnings growth is expected to slow down. To know more about the latest analysts predictions for the company, check out this visualization of analyst forecasts for the company.
This article by Simply Wall St is general in nature. It does not constitute a recommendation to buy or sell any stock, and does not take account of your objectives, or your financial situation. We aim to bring you long-term focused analysis driven by fundamental data. Note that our analysis may not factor in the latest price-sensitive company announcements or qualitative material. Simply Wall St has no position in any stocks mentioned.
Have feedback on this article? Concerned about the content? Get in touch with us directly. Alternatively, email editorial-team@simplywallst.com.

