
 Yahoo News
 The top 100 seats Labour is targeting in the general election

As voters prepare to cast their votes in the 2024 general election, it looks as though Labour could be on course for a landslide victory.
A recent More in Common poll has suggested Labour could win a majority of 210 seats when Brits head to the polls on July 4, while a YouGov study has indicated that Labour is in line for a total of 431 seats while the Tories could win just 102.
Sir Keir Starmer's party will be targeting dozens of seats up and down the country in the hope of turning them from blue to red. The PA media agency has compiled a list of the top target seats for Labour, based on the size of the swing needed for the seat to be won.
READ MORE: Who are celebrities voting for in the general election 2024?
READ MORE: Who do I vote for in the general election 2024? The key points from the main parties' manifestos
Greater Manchester will be one of the regions to watch as three Conservative constituencies are listed in the top 20 seats with the smallest swing needed to go to Labour.
The election is being held using new constituency boundaries, which means the results cannot be compared directly with what happened at the last general election in 2019. To measure how well the parties do at the election, and to determine which seats they need to win to form a government, a set of notional results for the 2019 election has been calculated to show what would have happened if that contest had taken place using the new boundaries.
These notional results have been compiled by Professor Colin Rallings and Professor Michael Thrasher of the University of Plymouth, on behalf of the PA news agency, the BBC, ITN and Sky News. The lists is based on the size of the swing in the share of the vote needed to gain the seat, calculated using the notional outcome in 2019.
The top 100 Labour target seats
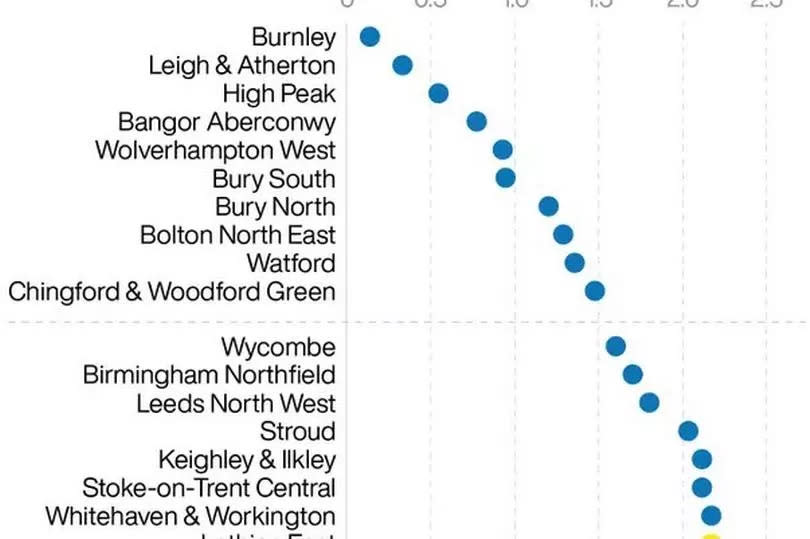
The list is ranked using the size of the swing needed. The name of the constituency is followed in brackets by the notional 2019 winner of the seat, then by the size of the swing needed to gain, in percentage points.
Burnley (Con) 0.13 percentage points
Leigh & Atherton (Con) 0.33
High Peak (Con) 0.54
Bangor Aberconwy (Con) 0.77
Wolverhampton West (Con) 0.92
Bury South (Con) 0.94
Bury North (Con) 1.20
Bolton North East (Con) 1.28
Watford (Con) 1.35
Chingford & Woodford Green (Con) 1.47
Wycombe (Con) 1.59
Birmingham Northfield (Con) 1.69
Leeds North West (Con) 1.80
Stroud (Con) 2.03
Keighley & Ilkley (Con) 2.11
Stoke-on-Trent Central (Con) 2.11
Whitehaven & Workington (Con) 2.17
Lothian East (SNP) 2.17
Gedling (Con) 2.22
Walsall & Bloxwich (Con) 2.40
Peterborough (Con) 2.47
Vale of Glamorgan (Con) 2.57
West Bromwich (Con) 2.60
Cheshire Mid (Con) 2.66
Wakefield & Rothwell (Con) 2.67
Ynys Mon (Con) 2.69
Derby North (Con) 2.70
Bridgend (Con) 2.73
Clwyd North (Con) 2.76
Lancaster & Wyre (Con) 3.05
Hastings & Rye (Con) 3.36
Eltham & Chislehurst (Con) 3.37
Cowdenbeath & Kirkcaldy (SNP) 3.41
Lincoln (Con) 3.47
Hyndburn (Con) 3.48
Broxtowe (Con) 3.58
Chipping Barnet (Con) 3.60
Northampton North (Con) 3.85
Newton Aycliffe & Spennymoor (Con) 3.93
Hendon (Con) 4.01
Truro & Falmouth (Con) 4.04
Wrexham (Con) 4.18
Hull West & Haltemprice (Con) 4.35
Blackpool South (Con) 4.36
Calder Valley (Con) 4.52
Milton Keynes Central (Con) 4.70
Southampton Itchen (Con) 4.74
Clwyd East (Con) 5.00
Glasgow North East (SNP) 5.01
Darlington (Con) 5.36
Redcar (Con) 5.45
Ipswich (Con) 5.53
Coatbridge & Bellshill (SNP) 5.54
Altrincham & Sale West (Con) 5.61
Swindon South (Con) 5.70
Cities of London & Westminster (Con) 5.73
Airdrie & Shotts (SNP) 5.74
Bolsover (Con) 5.77
Shipley (Con) 5.78
Crewe & Nantwich (Con) 5.79
Loughborough (Con) 5.90
Midlothian (SNP) 5.92
Rutherglen (SNP) 5.97
Tipton & Wednesbury (Con) 6.14
Rushcliffe (Con) 6.18
Norwich North (Con) 6.31
Spen Valley (Con) 6.42
Glasgow South West (SNP) 6.43
Milton Keynes North (Con) 6.55
Worcester (Con) 6.64
Glasgow North (SNP) 6.72
Rother Valley (Con) 6.74
Southport (Con) 6.80
Ashfield (Con) 6.81
Shrewsbury (Con) 6.96
Worthing East & Shoreham (Con) 7.03
Caerfyrddin (Con) 7.04
Penistone & Stocksbridge (Con) 7.28
Barrow & Furness (Con) 7.43
Ceredigion Preseli (Plaid Cymru) 7.49
Colne Valley (Con) 7.50
Filton & Bradley Stoke (Con) 7.61
Glasgow East (SNP) 7.62
Uxbridge & South Ruislip (Con) 7.82
Pembrokeshire Mid & South (Con) 7.84
Thanet East (Con) 7.91
Corby & East Northamptonshire (Con) 8.05
Leeds South West & Morley (Con) 8.16
Hamilton & Clyde Valley (SNP) 8.18
Bishop Auckland (Con) 8.19
Chelsea & Fulham (Con) 8.21
Crawley (Con) 8.38
Na h-Eileanan an Iar (SNP) 8.42
Harrow East (Con) 8.59
South Ribble (Con) 8.65
Newcastle-under-Lyme (Con) 8.73
Bournemouth East (Con) 8.94
Stevenage (Con) 8.98
Motherwell, Wishaw & Carluke (SNP) 9.23
Glasgow South (SNP) 9.42

