
 Yahoo News
 Uber shares data to show how the Australian commute is still horrible
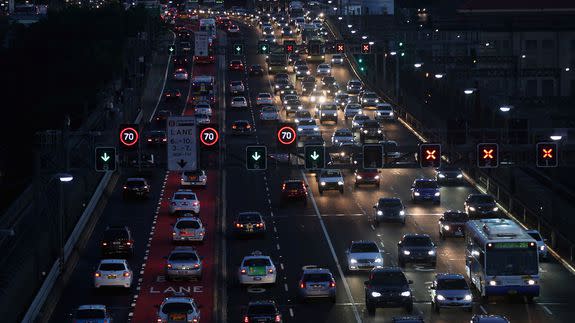
Uber drivers are on the road every hour of the day, but the data they generate about traffic and average travel times has been mostly unavailable to outsiders.
In a new move for the company locally, Uber has partnered with policy group Infrastructure Partnerships Australia (IPA) to produce the IPA Transport Metric, a report intended to inform government decision making on road and transport investment.
Announced Monday, the metric measures "road network performance" in Perth, Brisbane, Melbourne and Sydney and uses Uber trip data to drill down into average travel times at different hours of the day.
SEE ALSO: UberEats is going global, expanding into 22 more countries
"We trust the introduction of the IPA Transport Metric will provide some valuable insights for government and industry and contribute to the debate around important city-shaping infrastructure and planning decisions across the country," Uber general manager for Australia and New Zealand David Rohrsheim said in a statement.
Uber provided aggregated data from its app about journey times on specific routes, an Uber spokesperson told Mashable. There's no link back to individual trips and the numbers were provided at scale.
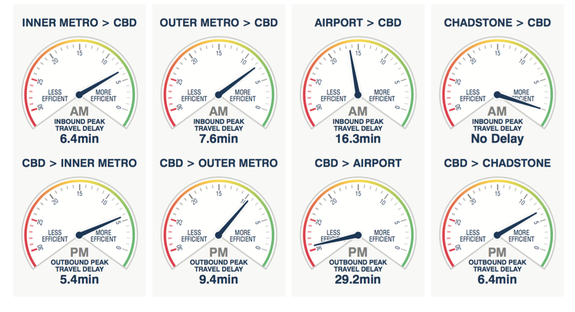
Image: IPA Transport Metric
According to the report, Uber has 42,000 active "driver partners" across the country that produce useful road data, including 14,000 in Sydney and Melbourne respectively, as well as 5,000 in both Brisbane and Perth.
The Uber data contained good and bad news for the average commute.
Travel times at peak have worsened in Sydney and Melbourne between April 1 and June 30 2016, the report indicated, but improved in Perth and stayed mostly the same in Brisbane. The times were compared to a 2015 base year.
Driving from downtown Melbourne to the airport had grown considerably more inefficient during April 1 to June 30 2016, with an outbound peak travel delay of 29.2 minutes. In Sydney, driving from the airport to the central business district had slightly improved in the same period, but still had an inbound travel delay of 11.2 minutes at peak times.
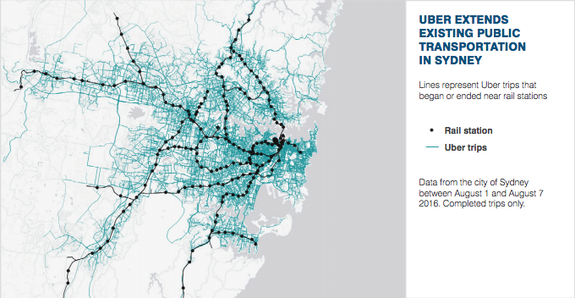
Image: IPA Transport Metric
Contributing to the report is another way Uber is beginning to participate in conversations about road management and transport in Australia.
In September, the company announced a partnership with the travel planning app TripGo to help users request Uber trips to nearby transport hubs.
At the time, it revealed to Mashable that 10 percent of Uber trips in Sydney start or end within 200 metres (656 feet) of a medium frequency public transport hub.
"Aligning ridesharing with public transport systems is one of the smartest ways to help people move around the city without the need for costly infrastructure developments or owning a personal vehicle," Rohrsheim said at the time.
