
 Yahoo News
 Census: One in 10 households contain people of two or more ethnicities
One in 10 households in England and Wales contain people of two or more ethnicities, according to census data revealing an “increasingly multi-cultural society”.
Around 2.5 million households (10.1%) contained members from at least two different ethnic groups in 2021, the Office for National Statistics (ONS) said.
This is an increase from 8.7% in 2011, the ONS said.
It comes as 81.7% of residents in England and Wales described themselves as white on the day of the 2021 census, down from 86.0% a decade earlier.
Within this group, 74.4% (44.4 million) identified their ethnic group as “English, Welsh, Scottish, Northern Irish or British” – down from 80.5% (45.1 million) in 2011, and from 87.5% (45.5 million) in 2001.
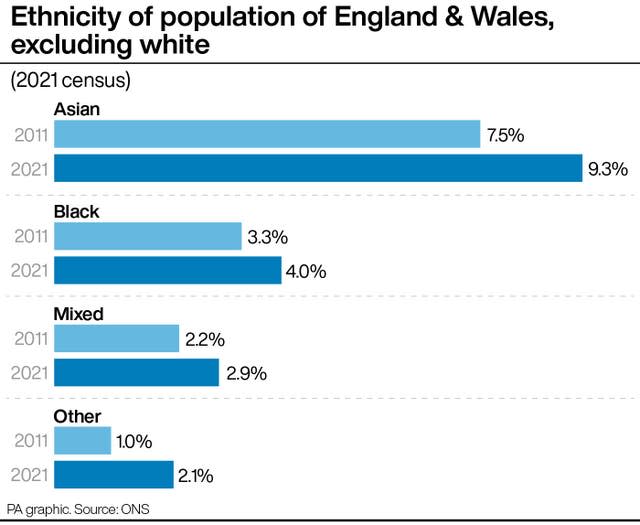
The second most common ethnic group was “Asian, Asian British or Asian Welsh” at 9.3% – up from 7.5% in 2011.
Among the three largest changes was the rise in the number of people identifying as “White: Other White”, which stood at 3.7 million (6.2%) in 2021, up from 2.5 million (4.4%) in 2011.
The largest groups in this category include “White: Polish”, with 614,000 (1.0%) of the overall population identifying this way, and “White: Romanian”, with 343,000 people (0.6%) identifying this way.
Other significant changes include numbers identifying their ethnic group as “Other ethnic group: Any other ethnic group”, which rose to 924,000 (1.6%), up from 333,000 (0.6%) in 2011.
And people ticking the “Black, Black British, Black Welsh, Caribbean or African: African” category rose to 1.5 million (2.5%), up from 990,000 (1.8%) in 2011.
The ONS said many factors may be contributing to the changing picture, including differing patterns of ageing, fertility, mortality, and migration.
In London, which remains the most ethnically diverse region of England, 3.2 million people (36.8%) identified as “White: English, Welsh, Scottish, Northern Irish or British” in 2021, down from 3.7 million (44.9%) in 2011.
Leicester, Luton and Birmingham are among parts of the country where people identifying as white now form a minority of the population, the data shows.
Some 14 local authorities recorded more than half of their usual residents as identifying with an ethnic group other than white, with the highest proportion in the London boroughs of Newham (69.2%), Brent (65.4%) and Redbridge (65.2%).
Outside London the highest non-white proportion is in Slough in Berkshire (64.0%), followed by Leicester (59.1%), Luton (54.8%) and Birmingham (51.4%).
Separate census data found that 53.8 million (90.3%) of usual residents identified with at least one UK national identity – English, Welsh, Scottish, Northern Irish, British, and Cornish.
This is slightly down from 92.0% in 2011.
Almost one in 10 people (9.7% – 5.8 million people) identified with a non-UK identity only.
Among this group, the most common response was those describing their national identity as Polish (593,000 – 1%), followed by Romanian (477,000 – 0.8%).
The latter represents a rise from 73,000 (0.1%) in 2011 – the largest increase for any non-UK national identity.
Census deputy director Jon Wroth-Smith said. “Today’s data highlights the increasingly multi-cultural society we live in.
“The percentage of people identifying their ethnic group as ‘White: English, Welsh, Scottish, Northern Irish or British’, continues to decrease.
“Whilst this remains the most common response to the ethnic group question, the number of people identifying with another ethnic group continues to increase.
“However, the picture varies depending on where you live. London remains the most ethnically diverse region of England, where just under two-thirds identify with an ethnic minority group, whereas under 1 in 10 identify this way in the North East.
“But despite the ethnically diverse nature of society, 9 in 10 people across England and Wales still identify with a UK national identity, with nearly 8 in 10 doing so in London.”

